Difference between bars and wheel

Hi, I’m new here and just getting used to the cronometer app.
I’m confused by the calories summary charts.
On the horizontal bars it shows these results:
Fats – 93%
Protein – 68%
Carbs – 8%
However, on the wheel with Calorie Breakdown written inside, it shows this:
Fats – 81.4%
Protein – 16.5%
Carbs – 2.1%
Which one should I rely on for my ketogenic macros?
Thanks for your help.
Migrated from the old cronometer forums.
This was orginally posted on the old cronometer.com forums by a user kept here for continuity.
As always, any and all utterances here are covered by our T&Cs:
https://forums.cronometer.com/discussion/27/governing-terms-and-disclaimer
Comments
-
The horizontal bars show you how much in percentage of each macro you have eaten, e.g. if you are supposed to eat 125g of protein, and you have eaten 100g, you would get 100/125*100% = 80%. You still need to eat 25g / 20% more for the day.
The calorie wheel breakdown shows you how much in percentage of your total energy comes from each macronutrient (protein, fat, carbs, alcohol). It would always add up to 100%.
The easiest info to work from while you’re still eating through the day would be the horizontal bar. But for your purpose, the wheel shows the macro breakdown of your diet; i.e. you’d tell people you eat roughly 80% fat, 15% protein, 5% carbs, etc.
Migrated from the old cronometer forums.
This was orginally posted on the old cronometer.com forums by a user kept here for continuity.
As always, any and all utterances here are covered by our T&Cs:
https://forums.cronometer.com/discussion/27/governing-terms-and-disclaimer -
That explains it perfectly Vickie, thank you very much ????
Migrated from the old cronometer forums.
This was orginally posted on the old cronometer.com forums by a user kept here for continuity.
As always, any and all utterances here are covered by our T&Cs:
https://forums.cronometer.com/discussion/27/governing-terms-and-disclaimer -
I also found, by accident, that if you 'hover' over the colors, they tell you very helpful information. If I hadn't read this, I would have never known

Where I struggle is understanding the nutritional targets section, and will be reviewing the video/user manual next week to try to get my head wrapped around the value.
-
Susan Macfarlane, MScA, RD
Registered Dietitian Nutritionist
cronometer.com
As always, any and all postings here are covered by our T&Cs:
https://forums.cronometer.com/discussion/27/governing-terms-and-disclaimer -
The calorie wheel breakdown gives the percentage of total carbs, not net carbs - is there any way to have the calorie wheel reflect net carbs?
I am following the keto diet, and all my settings reflect net carbs, but I noticed today that the calorie wheel is a little deceptive as it shows full carbs. My carb percentage has been around 10%, so I have been cutting back to get closer to 5%, and the percentage was still not going down. I noticed today the carb percentage virtually cut in half after I deleted my fiber supplement (psyllium husks that have zero net carbs). So I have been eating much fewer carbs than what I should be eating. Showing net carbs on the calorie wheel would help tremendously. If there is a setting to reflect that, it would be greatly appreciated.
Thanks!
-
HI @mitchml ,
You can track %target Net Carbs in the "Nutrient Target" section (i.e. the individual nutrient wheels), as well as in the bars that are shown next to the calorie breakdown wheel. @Karen_Cronometer or @Hilary will be able to provide additional guidance if needed.
Kind regards,
Susan Macfarlane, MScA, RD
Registered Dietitian Nutritionist
cronometer.com
As always, any and all postings here are covered by our T&Cs:
https://forums.cronometer.com/discussion/27/governing-terms-and-disclaimer -
-
@mitchml
The percentages listed within the "Total Macronutrient Breakdown" bar graphic indicate the percentage of your goal that you have reached.
The Circle Graph to the right of this is measuring the Number of Calories of each nutrient you have eaten as a fraction of the Total amount of Calories you have consumed. This graph will always be set to total Carbohydrates.
The percentage listed in the Calories Summary graph is also measuring the Number of Calories of each nutrient you have eaten as a fraction of the Total amount of Calories you have consumed.Hilary
cronometer.com
As always, any and all postings here are covered by our T&Cs:
https://forums.cronometer.com/discussion/27/governing-terms-and-disclaimer -
Thank you for responding so quickly Susan, I appreciate it! I guess I did not explain my request clearly, let me see if I can explain it better.
I am not looking for my net carb percent of daily goal as is found in the two places you noted (say as an example, consuming 91% of my net carb goal). I’m interested to see my three macro percentages based on my targeted calories. My goal is 75%/20%/5% fat/protein/net carbs per day. So at any give time, I would like to see how I stand on the percentages for those three, exactly like the calorie breakdown wheel, but instead of showing total carbs as it currently does, I am wondering if there in an option to see net carbs. The breakdown wheel is a great, quick reference to see my percentages of fat, protein, and carbs based on total calories, but it would be more helpful to see net carbs instead of total carbs.
I hope this makes more sense, thank you!!
Michelle
-
Where can I find a guide for deciphering the nutrient balance wheels at the bottom of my nutrition summary page?
-
Hi DJS1049,
There is a bit of an explanation if you click on the gear icon in the nutrient balance section of the diary page to expand the settings.
The gauges are meant to display the ratio of the two nutrients listed below each gauge.
For example, an Omega 6:Omega 3 ratio of 10:1 means that for every 10 grams of Omega 6 there is 1 gram of Omega 3.You can look at the gauge above as the value of the first nutrient divided by the value of the second nutrient. Using the same example 10/1 = 10. This number is displayed at the bottom of the gauge. Increasing omega 3 will reduce this number, or if you are planning your food for the future, reducing omega 6 will also reduce the ratio.
These nutrients interact with one another, so keeping your intake in the green zone of the nutrient balance gauge will optimize the amount of each nutrient you can use.
Learn more about these nutrient ratios on our blog:
https://cronometer.com/blog/cronometers-nutrient-ratios-calcium-magnesium/
https://cronometer.com/blog/nutrient-ratios-zinccopper/
https://cronometer.com/blog/understanding-cronometers-nutrient-ratios/Learn more about the PRAL Alkalinity index here: https://cronometer.com/blog/alkaline-diet/
Best,
Karen Stark
cronometer.com
As always, any and all postings here are covered by our T&Cs:
https://forums.cronometer.com/discussion/27/governing-terms-and-disclaimer -
I'm still confused. I've read through many of the posts and articles. Attached is a current screen shot of my own nutrients. When you say: "You can look at the gauge above as the value of the first nutrient divided by the value of the second nutrient. Using the same example 10/1 = 10. This number is displayed at the bottom of the gauge." Using my screen shot and focusing only on zinc:copper only, which two numbers should I be dividing? My copper targets in settings are 0.9 min, 10 max; zinc: 8.0 min, 40 max. Where is 0 and 20 coming from? How did we arrive at 36.591? I'm assuming I need more zinc and calcium... or am I getting too much? Help!

-
@Dshiny I don't blame you; I had to read through the online explanations maybe six times before I could see how to interpret those charts correctly. They seemed counterintuitive, to say the least.
There are several posts from Cronometer about these; the only one I found that could help me interpret my own results was this one: https://support.cronometer.com/hc/en-us/articles/360018348631-Nutrient-Balances
There it says: "So if your balance of Calcium: Magnesium shows your value on the right of optimal, you can decrease the ratio by either adding more magnesium or removing some calcium from your diet, to improve the balance." At first that seemed the opposite, but then I realized that if we want to lower the dial to the left, we need to add more to the denominator (numerator/denominator) on the right side of the chart in order to decrease the value in the chart toward the more favorable green zone.
You don't have to do any dividing yourself; they've already done that in the chart based on your diary. So in your own calcium/magnesium chart, which is the same as the example Cronometer gives, it looks like you would need to increase the bottom number (magnesium) for a better Cal-Mg balance. That's hard to do for most people; that's why I've been taking magnesium supplements for years, and it shows up well in my blood tests for Mg. You might have to try a few types of mag supplements before you find one that works best for you, since too much can upset your stomach if you're sensitive to it.
And then it looks like your zinc levels could use more copper to balance them out. Assuming you are relying on just food values in the diary and not added supplements, you might find some advice in Cronometer or online with which foods are rich in copper, or add some micro-mineral supplements.
Frankly, as much as I think Cronometer is really a great software, I think they missed the mark on usability with the way these charts for nutrient balance are displayed. I'm not sure what changes I can suggest, but if I come up with a better graphic solution, I'll submit it as a suggestion.
-
-
It is hard to believe, after all these years, that you still have to 'hover' over the Energy Summary's wheels to determine the percentage of fat, carbs, and protein. Worse, is that the percentage consumed of each on the wheel does not even match the Nutrients section. For example, the wheel shows 81%, but if I go to Nutrition Targets, that wheel shows 141% !! If I go to the Targets section, the ratio is also 141% and I have manually calculated and this is WRONG. Cronomoter has steadily increased fees and added people but this is a very basic request for usability that has not changed much since 2018.
-
@jerbir the folks above have broken it down somewhat, but I'll share my understanding: the Targets' bars are describing the percentage of your Macro target, while the Energy Summary Consumption wheel is describing what percentage of your consumed calories belongs to each macro.
So, for folks like myself, who have a specific protein target to meet for the day, I'm mostly looking at the "Targets" section.
Here's a tangible example. Let's say I just had a cup of coffee and a double-portion protein shake for breakfast and entered that:
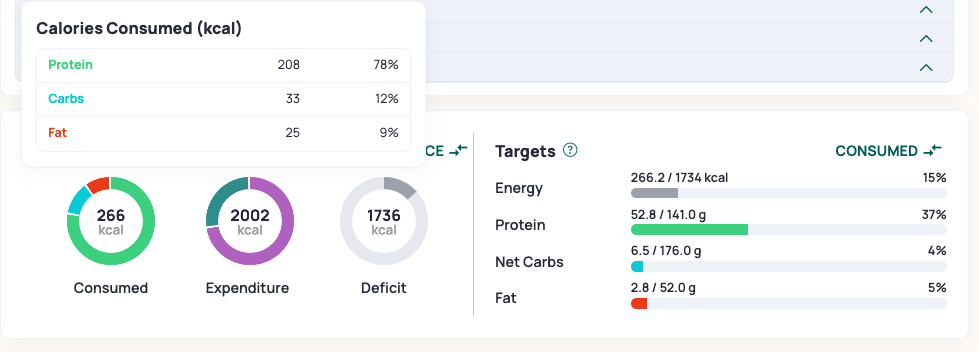
So I am 37% through my daily target of 141g of protein, shown on the right. This is important for me to know, because I am prioritizing protein intake.
However, since these 266kcal are all I have consumed so far on this hypthetical day, and this was protein powder, the protein makes up a large percentage of my Consumed calories: 78%.
This flow works pretty well for me. But I imagine it can less convenient for someone like the poster above, who wants to be at 5% carbs at any given moment of the day (if I'm understanding that right).
As far as the "WRONG"ness, I figure the number you're using to calculate is [protein in g] * 4. Which, to my understanding, is more of an average than a hard and fast rule 🤷